Effects of sleep quality and physical activity measured by a Fitbit and self-rated questionnaire on the health-related quality of life in community-dwelling older adults: A cross-sectional study
Article information

Abstract
Purpose
This study aimed to identify influencing factors on health-related quality of life by examining relationships among sleep quality, physical activity, and health-related quality of life in older adults living in the community using a Fitbit and self-rated questionnaire.
Methods
The participants were adults aged 65 years and above who were recruited from one senior university and three senior citizen centers. A total of 106 participants were included in the analysis. The data were analyzed with t-test, ANOVA, Pearson’s correlations, and multiple regression analysis.
Results
According to multiple regression analysis regarding objectively measured sleep quality and physical activity using a Fitbit, the factors affecting the health-related quality of life were age (β=-.30, p=.006), subjective health status as ‘moderate’ (β=.33, p=.001), and subjective health status as ‘good’ (β=.41, p=.001). In terms of using a self-rated questionnaire, the factors affecting health-related quality of life were age (β=-.27, p=.010), subjective health status as ‘moderate’ (β=.32, p=.001), subjective health status as ‘good’ (β=.37, p=.001), and physical activity (β=.18, p=.030).
Conclusion
Although the findings may not be generalizable to community-dwelling older adults due to our convenience samples, this study suggests that customized physical activity programs are required to improve health-related quality of life in community-dwelling older adults of different age groups.
INTRODUCTION
1. Background
The proportion of the Korean population aged 65 years and older is expected to exceed 20% by 2025 and increase to 35.3% by 2040 [1]. As the number of older people are growing, there is increasing social interest in health-related quality of life (HRQoL) for older people to live a healthy and happy life rather than simply extending their lifespan [2]. HRQoL is a health status based on an individual’s subjective assessment and has been described as an individual’s degree of satisfaction with various dimensions of health, including physical, mental, and social health, as evaluated from a subjective perspective [3]. HRQoL indicates the health levels of individuals and population groups, and is useful for assessing older adults’ daily functioning and well-being [3].
Sleep plays an important role in improving HRQoL, as it can help people recover from fatigue and recharge their minds and bodies, so good sleep is important for maintaining health and improving quality of life [4]. In older adults, sleep quality has been shown to decline with age, with older adults spending more time in bed but less time sleeping, leading to decreased sleep efficiency [5]. These changes in sleep patterns in older adults can affect their daytime activities, causing decreased overall clarity, increased napping, fatigue, drowsiness, and accident-prone behaviors, leading to decreased quality of life [5]. Sleep disorders in older adults are associated with a variety of health problems and can increase the risk of mortality [6]. Efforts to improve sleep quality are needed to improve HRQoL in older adults, and it is important to first understand their sleep status. Sleep comprises many different aspects, including quantitative measures such as sleep duration, number of awakenings, and time to fall asleep, and qualitative measures such as depth of sleep, and satisfaction with sleep [7]. Owing to the multidimensional characteristics of sleep, it is appropriate to combine objective assessments using polysomnography or sleep activity recording devices with subjective assessments using questionnaires; however, until now, sleep assessment has mostly been subjective using questionnaires [4,8]. Recently, more studies have objectively measured sleep using wearable devices such as Fitbit [8,9]. It is necessary to measure sleep in older adults using objective and subjective measures to understand the impact of sleep on HRQoL.
According to the Korean Ministry of Health and Welfare, the aerobic exercise rate for older adults was 33.2% as of 2020, which falls short of the HP2030 aerobic exercise rate target of 33.6% [10]. Physical activity in older adults helps prevent falls and fall-related injuries, improves bone health and sleep quality, and positively impacts HRQoL [11]. To better understand the relationship between physical activity and HRQoL, it is important to measure physical activity, which can be done subjectively using questionnaires and objectively using a pedometer or Fitbit. When measuring physical activity using self-rated questionnaires, it can be difficult for older adults to accurately recall their past physical activity due to memory and cognitive problems caused by aging [12]. Recently, studies on physical activity have increasingly used pedometers or Fitbits to supplement self-rated questionnaires and secure objective data [13]. It is necessary to measure physical activity in older adults using objective and subjective measures to understand the impact of physical activity on HRQoL.
To date, studies on the effects of sleep and physical activity on the HRQoL of older adults have been consistently conducted on various groups of older adults, including hospitalized and outpatient older adults. However, most of the studies have been subjective assessments using self-rated questionnaires to measure sleep and physical activity in older adults [4]. With the recent development of technology, using Fitbit, it has become possible to measure sleep and physical activity continuously for 24 hours in daily life. As the reliability and validity of the data measured by Fitbit have been verified, studies on physical activity and sleep using Fitbit are increasing [9,13], but they have not yet been found in Korea. Therefore, this study aimed to identify influencing factors on HRQoL by examining relationships among HRQoL, sleep quality and physical activity measured objectively and subjectively by Fitbit and self-rated questionnaires among community-dwelling older adults.
METHODS
Ethic statement: This study was approved by the Institutional Review Board (IRB) of Gyeongsang National University (IRB No. GIRB-A22-Y-0052). Informed consent was obtained from the participants.
1. Study Design
This was a descriptive correlational study to determine influencing factors on HRQoL by examining relationships among HRQoL, sleep quality and physical activity in community-dwelling older adults. This study was performed according to the Strengthening the Reporting of Observational Studies in Epidemiology (STROBE) Reporting Guidelines (http://www.strobe-statement.org/).
2. Study Participants
The participants of this study were community-dwelling older people aged 65 years or older who attended one senior college and three senior centers in Jinju City. The selection criteria were as follows: First, they should be able to perform daily physical activities independently. Second, each had a smartphone that could download a Fitbit application. Third, participants scored at least 18 on the Korean Mini-Mental State Examination (K-MMSE) and could communicate. The cutoff value for the K-MMSE score was based on a feasibility study of dementia screening in community-dwelling Korean older adults, which found that the optimal cutoff score for dementia screening was 18 [14]; therefore, the participants in this study had a score of 18 or higher. The exclusion criteria were those who were taking sleeping pills regularly prescribed by the hospital, those who complained of depression or pain that interfered with sleep, those with chronic diseases that may affect sleep (e.g., cerebrovascular diseases such as stroke and heart failure), and those taking antidepressants or antipsychotic medications.
The sample size was calculated based on the significance level (α)=.05, medium effect size=.15, power (1-β)=.80, and eight predictors for regression analysis using the G*power 3.1.9.7 program, and the minimum sample size was 109. Considering the dropout rate, 120 participants received the questionnaire and the Fitbit, and 106 copies of the data were used in the final analysis, excluding the data of 14 participants who failed to use the Fitbit for two consecutive days.
3. Measurements
The participants’ general characteristics included sex, age, spouse, educational level, and monthly household income. The disease-related characteristics consisted of subjective health status and the presence of underlying diseases.
1) HRQoL
The HRQoL was measured using the Korean version of the Euro Quality of Life Questionnaire 5-Dimensional Classification (EQ-5D) developed by the EuroQol Group [3]. To use the tool, we received the Korean version of HRQoL by mail after approval through the registration process of the EuroQol Group. The EQ-5D consists of five domains: mobility, self-care, usual activities, pain/discomfort, and anxiety/depression, and is organized into three levels: no problem at all (1), some problem (2), and severe problem (3). If each question is answered with 2 or 3, it is judged that there is a problem in each sub-dimension. In this study, the values were calculated using the EQ-5D weighting formula specialized for Koreans in the study by Lee et al. [15], and the HRQoL scores ranged from -0.17 to 1. The higher the weighted score, the higher the HRQoL. The reliability was Cronbach’s ⍺=.81 in this study.
2) Sleep Quality
Sleep quality was assessed using the Fitbit and the Korean versions of the Pittsburgh Sleep Quality Index. (PSQI-K) Fitbit is a device equipped with real-time heart rate monitoring and sensitive motion detection and has been tested for validity and reliability for sleep quality and quantity [9]; its sleep measurement accuracy is 96%. We first measured the total sleep time, total bedtime, and sleep efficiency using a Fitbit Versa. The Fitbit was worn 24 hours a day for 3 days, and data from two consecutive 48-hour nights were used. In a systematic review of Fitbit’s accuracy in measuring sleep, 22 studies were analyzed and used data from 1 to 13 days, with 15 studies using Fitbit data from 1 day [16]; therefore, we used data from 2 days of wear.
To measure sleep quality using questionnaires, we used the Korean version of the PSQI-K developed by Buysse et al. [17] and validated for reliability and validity by Sohn et al. [18], the PSQI-K. This tool subjectively assesses sleep over the past month and consists of seven subscales: subjective sleep quality, sleep latency, sleep duration, habitual sleep efficiency, sleep disturbance, use of sleep medication, and daytime dysfunction, totaling 18 questions. Each domain was scored on a scale of 0 to 3, with a minimum score of 0 and a maximum score of 21. Higher scores indicated poorer sleep quality. The PSQI-K by Shon et al. [18] uses a cutoff of 8.5 to categorize people as “good sleepers” if their overall sleep quality score is below 8.5 and “poor sleepers” if it is above 8.5. The reliability of the tool was Cronbach’s ⍺=.83 at the time of development, Cronbach’s ⍺=.84 by Shon et al. [18], and Cronbach’s ⍺=.67 in this study.
3) Physical Activity
Physical activity was measured using the Fitbit and Korean versions of the World Health Organization’s International Physical Activity Questionnaire Short-Form (IPAQ-SF). Fitbit is a device with real-time heart rate monitoring and sensitive motion detection and has validated the validity and reliability of physical activity [13]. Physical activity measured by the Fitbit is a step. The Fitbit was worn 24 hours a day for 3 days, and data from two consecutive 48-hour days were used.
The IPAQ-SF tool, which can be downloaded for free [19], is a seven-item questionnaire that measures the frequency (number of times per week) and duration (minutes) of vigorous physical activity, moderate physical activity, and walking in the past 7 days, multiplied by a Metabolic Equivalent Task (MET) value (8.0 MET for vigorous activity, 4.0 MET for moderate activity, and 3.3 MET for walking) based on the intensity of the activity. Total physical activity was defined as the sum of vigorous, moderate, and walking MET scores. The categorical score was categorized into three tiers based on the METs for total physical activity and the type and duration of physical activity. Tier 1 had the lowest level of physical activity, categorized as those who were not in Tier 2 or 3. Tier 2 (moderate physical activity) was defined as vigorous physical activity for at least 20 minutes per day for at least 3 days per week, moderate physical activity for at least 30 minutes per day for at least 5 days per week, or a combination of walking, moderate activity, or vigorous physical activity for at least 5 days per week which equals 600 METs. Tier 3 (high level of physical activity) is when one spends at least 1,500 METs on vigorous physical activity 3 or more days per week or 3,000 METs on a combination of walking, moderate physical activity, and vigorous physical activity 7 days per week.
4. Data Collection
The data for this study were collected from September 2022 to October 2022 from community-dwelling older people aged 65 years or older living in Jinju City. Data was collected after approval from the Institutional Review Board (GIRB-A22-Y-0052). The purpose and contents of the study were explained to each person in charge, and recruitment documents were posted after obtaining permission. Participants who want to participate in the study were given a questionnaire after signing an informed consent form that included information on the purpose and procedures of the study and the expected benefits and disadvantages of participating. If older adults needed assistance in completing the questionnaire, the researcher read it to them in the presence of an impartial observer, such as a staff member of a geriatric college or the president of a senior center. The researcher recorded participants’ responses to the questions, and the questionnaire took approximately 25 minutes to complete. After completing the questionnaire, Fitbit devices (product name: Fitbit Versa) were distributed to measure the walking and sleeping status of older adults. Written instructions were provided to individually explain the use and precautions of the device and refer to the use of Fitbit at home. The researcher personally fitted the Fitbit to the participant’s wrist and trained the participant to wear the device 24 hours a day for 3 consecutive days. A daily text message was sent to the participants to assist them with continuous 24-hour wear. Once the participants finished wearing their Fitbit, they logged into the website associated with their Fitbit device. They downloaded their sleep quality (total sleep time, total bed time, and sleep efficiency) and physical activity (steps) using an Excel file stored on the dashboard. At the end of the study, the researcher personally collected the Fitbit and provided a small present to each participant.
1) Data Analysis
SPSS/WIN software (version 27.0; IBM Corp.) was used to analyze the collected data. First, the general and disease-related characteristics of the participants were analyzed using counts, percentages, means, and standard deviations. Second, sleep quality, physical activity, and HRQoL, as measured by the Fitbit and self-rated questionnaires, were analyzed using real numbers, percentages, means, and standard deviations. Third, the differences in HRQoL according to the general and disease-related characteristics of the participants were analyzed using an independent t-test and ANOVA, and Scheffe’s test was performed as a post-hoc test. Fourth, the correlations among HRQoL, sleep quality, and physical activity were analyzed using Pearson’s correlation coefficients. Fifth, multiple regression analysis was used to determine the effects of sleep quality and physical activity measured by the Fitbit and self-rated questionnaires on the HRQoL.
RESULTS
1. General and Disease-Related Characteristics of Participants
The gender of participants was 61.3% female, with an average age of 75.9±7.0 years, and 45.3% aged 70~79 years. A total of 56.6% of the participants had a spouse, 47.2% had a junior high school diploma or higher, and 58.5% had a monthly household income of less than KRW 1 million. Regarding subjective health, 48.1% reported ‘moderate,’ and 82.1% reported having a underlying disease (Table 1).
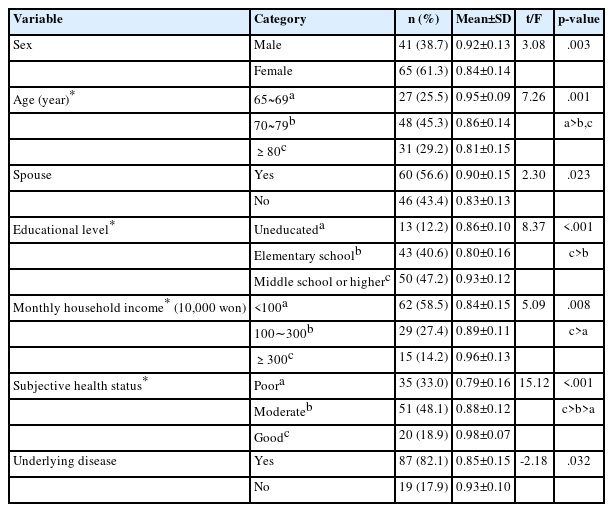
Differences of Health-Related Quality of Life by General and Disease-Related Characteristics of Participants (N=106)
2. Sleep Quality, Physical Activity, and HRQoL Measured Using a Fitbit and Self-Rated Questionnaires
Of the sleep quality metrics measured by Fitbit, total sleep time averaged 371.56±82.77 minutes, total bed time averaged 435.55±97.04 minutes, and sleep efficiency averaged 92.05%±3.43%. The sleep quality score measured by the self-rated questionnaire was 6.26±3.45 out of 21, with 74.5% of the participants getting adequate sleep, with a sleep quality score of 4.59±1.91, and 25.5% of the participants getting poor sleep, with a sleep quality score of 11.15±1.86. Analyzing the self-rated questionnaires, the average total sleep time was 372.08±96.86 minutes, and the average total bed time was 447.74±89.81 minutes.
The mean number of steps measured by Fitbit was 11,750.61±5383.65, with 45.3% of participants walking less than 10,000 steps per day (mean 7,202 steps) and 54.7% walking more than 10,000 steps (mean 15,514 steps). Total physical activity measured by the self-rated questionnaire was 4,351.83±5,302.52 METs, with 15.1% of participants in Tier 1 (low level of physical activity) receiving 361.47±151.17 METs, 37.7% in Tier 2 (moderate level of physical activity) receiving 1,624.55±718.58 METs, and 47.2% in Tier 3 (high level of physical activity) receiving 7,810.58±6,029.42 METs. Analyzing the self-rated questionnaires, it was found that the participants spent 79.37±64.05 minutes walking. The HRQoL score was 0.87±0.14 (range -0.171 to 1) (Table 2).

Degree of Sleep Quality, Physical Activity, and HRQoL (N=106)
3. Differences of HRQoL by General and Disease-Related Characteristics of Participants
The characteristics that showed differences in HRQoL according to the general and disease-related characteristics of the participants were gender (t=3.08, p=.003), age (F=7.26, p=.001), presence of a spouse (t=2.30, p=.023), educational level (F=8.37, p<.001), monthly household income (F=5.09, p=.008), subjective health status (F=15.12, p<.001), and presence of underlying disease (t=-2.18, p=.032) (Table 1).
4. Correlations Among Sleep Quality, Physical Activity, and HRQoL Measured Using a Fitbit and Self-Rated Questionnaires
We first examined the relationships between sleep quality, physical activity (steps), and HRQoL, as measured by Fitbit. We found a significant correlation between steps (r=.19, p=.048) and HRQoL. The correlations between sleep quality, physical activity, and HRQoL, as measured by self-rated questionnaires, showed that sleep quality (r=-.29, p=.002), physical activity (r=.33, p=.001), and HRQoL were significantly correlated (Table 3).

Correlation Among Sleep Quality, Physical Activity, and HRQoL (N=106)
5. Influencing Factors on HRQoL Measured Using a Fitbit and Self-Rated Questionnaires
Before conducting the multiple regression analysis, the variables were checked for normality and multicollinearity; a normal distribution was assumed, and no multicollinearity was found. When analyzing the effects of Fitbit-measured physical activity and participant’s characteristics on HRQoL, we found that HRQoL was significantly affected by subjective health rated as good versus poor (β=.41, p<.001), moderate versus poor (β=.33, p=.001), and age (β=-.30, p=.006), with an explanatory power of 43% (Table 4).
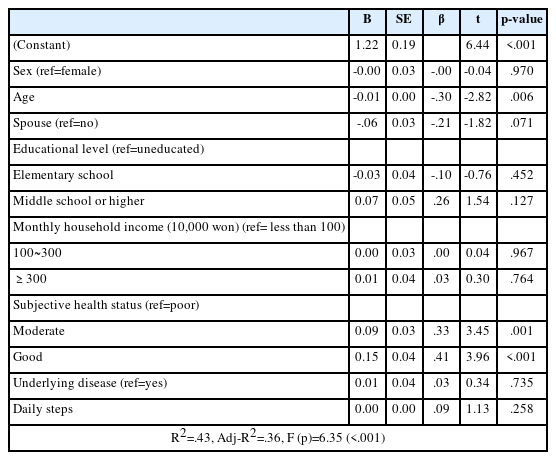
Influencing Factors on Health-Related Quality of Life Using Fitbit as Objective Measurement (N=106)
The effects of sleep quality, physical activity, and participants’ characteristics on HRQoL, as measured by a self-rated questionnaire, were examined and found to be significantly greater when subjective health status was good compared to poor (β=.37, p=.001), moderate compared to poor subjective health (β=.32, p=.001), age (β=-.27, p=.010), and physical activity (β=.18, p=.030), with an explanatory power of 46% (Table 5).
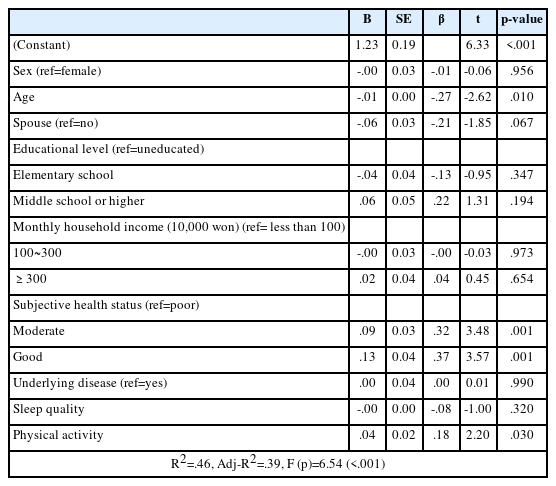
Influencing Factors on Health-Related Quality of Life Using Questionnaire as Subjective Measurement (N=106)
DISCUSSION
This study has intended to describe the degree of sleep quality and physical activity in older adults, as measured by Fitbit and self-rated questionnaires, in a community-dwelling older adults and to identify the impact of these factors on HRQoL. The mean score of HRQoL for the participants in this study was 0.87 (range -0.171 to 1). A previous study analyzing the influencing factors on HRQoL for 1,788 older adults using data from the National Health and Nutrition Examination Survey [20] found a score of 0.86, and a previous study examining HRQoL among older adults in Canada and Germany [21] found a score of 0.84 to 0.88, which is similar to our results. The HRQoL scores of the participants in this study was similar to those of Canadian and German seniors because the participants in this study were seniors who attended senior colleges or senior centers and had health conditions that allowed them to move around and perform daily activities on their own; thus, they have shown a high score on HRQoL by participating in various activity programs provided by the institutions. To maintain or improve the HRQoL of older adults, it is necessary to assess and manage health conditions that cause pain or discomfort, develop the capacity to manage one’s health, and explore the development of health promotion programs.
In this study, the sleep quality metric measured by the Fitbit and the self-rated questionnaire was total sleep time, which was 371.56 minutes (approximately 6 hours and 11 minutes) for the Fitbit and 372.08 minutes (approximately 6 hours and 12 minutes) for the self-rated questionnaire. A 2021 study [9] analyzing Fitbit data from people aged over 65 years in the United States found a total sleep duration of 395 minutes (approximately 6 hours and 35 minutes), similar to our results. According to the Centers for Disease Control and Prevention (CDC) [22], healthy adults sleep for at least 7 to 9 hours. Sleeping for less than 7 hours is associated with increased rates of diabetes, obesity, hypertension, and cardiovascular disease, as well as weakened immune function [22]. Although total sleep duration tends to decrease with age, and older adults tend to have more difficulty falling asleep and waking up more often during sleep [4,5], we should be concerned about sleep duration in older adults to reduce the negative effects of sleep deprivation. To ensure sufficient sleep for older adults, a sleep history questionnaire should be conducted to identify the factors that affect sleep and sleep hygiene education should be conducted according to the education and understanding levels of older adults.
In this study, the sleep quality score measured by the self-rated questionnaire was 6.26 (range 0~21), 25.5% of older adults had poor sleep, and their sleep quality score was 11.15±1.86. In a previous study [23] that examined sleep quality among community-dwelling people aged 65 years and older, the score was 4.71, indicating that the sleep quality in this study was worse than that in the previous study. Considering that previous studies using community health survey data reported that the older the age, the worse the sleep quality [24], the lower the percentage of 65- to 70-years olds and the higher the percentage of 80-year-olds in this study, the lower the sleep quality. For the elderly with poor sleep in this study, various measures are needed to improve their sleep quality by providing intervention programs tailored to their individual circumstances, such as assessing factors that interfere with sleep or shorten sleep latency or sleep counseling and cognitive behavioral therapy.
The seniors in this study took an average of 11,750 steps per day measured by a Fitbit and reported an average of 79.37 minutes of walking per day in a self-rated survey. It typically takes approximately 110 minutes for an adult to reach 10,000 steps or more, so the 11,750 average daily steps measured by Fitbit suggest that seniors walk for approximately 2 hours or more. However, the study participants reported about 79.37 minutes of walking in the self-rated survey. In comparison, the Fitbit data showed a difference of 11,750 steps (about 110 minutes), suggesting that older adults may have memory distortions when recalling their physical activity. This suggests that future studies on physical activity among the elderly should utilize objective measurement tools such as wearable devices and Fitbits to measure their activity levels more accurately and objectively.
In particular, 54.7% of the older adults in this study took an average of 15,514 steps daily, indicating adequate physical activity levels. Given that the participants in this study included active older adults attending a senior university and senior citizen centers with good subjective health status, a larger number of daily steps taken should be interpreted with caution when extrapolating to the entire population. Considering that a goal of 10,000 steps per day is appropriate for improving the health of adults and older adults [25], it is encouraging that the average number of steps taken by older adults in this study was 11,750. An analysis of the 2014~2017 National Health and Nutrition Examination Survey results showed that increased physical activity was associated with reduced odds of metabolic syndrome and its risk factors in both adults and older adults; however, the positive effects were more pronounced in older adults [26]. Furthermore, given that a meta-analysis showed that walking more than 10,000 steps per day was associated with a lower risk of all-cause mortality [25], there is a need for ongoing walking programs to maintain and improve health in those who walk fewer than 10,000 steps per day.
In this study, community-dwelling older adults measured by a self-rated questionnaire averaged 4,351 METs per day in the “high level of physical activity” category. In the 6th National Health and Nutrition Examination Survey [27], older adults aged 65 years and older had a mean of 2,278 METs, which was higher than the physical activity level of the older adults in this study. This difference may be because the participants in this study were active older adults who attended a senior university or senior citizen centers at least three times a week. In contrast, previous studies analyzing data from the National Health and Nutrition Examination Survey included a wide range of older adults with different ages and chronic diseases. As older adults experience muscle mass loss during the aging process and rapid muscle strength decline is a major contributor to falls, it is important to maintain high levels of physical activity among community-dwelling older adults.
To analyze the effects of HRQoL in this study, multiple regression analysis showed that younger age, better subjective health status, and more physical activity significantly affected HRQoL. First, physical activity, as measured by a self-rated questionnaire, was a significant factor affecting HRQoL in this study. Physical activity, as measured using a self-rated questionnaire, has been shown to affect HRQoL in several previous studies [11,27], supporting our findings. Regular exercise have been reported to maintain bone and muscle mass, improve muscle strength and endurance, enhance physical function, and improve HRQoL [11]. Therefore, it is necessary to provide various physical activity programs according to the characteristics and environment of older adults by age group to continuously maintain and promote physical activity and HRQoL in older adults.
In this study, subjective health status was the most influential factor in HRQoL. Previous studies have shown that a higher subjective health status is associated with a higher HRQoL, supporting the findings of this study [11,28]. Subjective health status has been proposed as an important factor that reflects an individual’s physical and mental state regardless of medical diagnosis. Self-rated health may be subjective and simple, but it has been proven to be a stronger predictor of health outcomes such as mortality or quality of life [29]. According to Statistics Korea, Koreans’ life expectancy, an objective health indicator, is higher than the Organization for Economic Cooperation and Development (OECD) average, but its subjective health is at the bottom among OECD countries [30]. Therefore, various strategies to promote positive perceptions of one’s health status is necessary.
As expected, age was found to be a significant factor affecting HRQoL. Previous studies [11,28] found that older age was associated with lower HRQoL scores, which is consistent with the results of this study. As the age increases, older adults experience multiple chronic diseases, and these diseases in old age affect the HRQoL of older adults by weakening their ability to perform daily activities, limiting their ability to live independently and be socially active, and adding material and mental burdens to themselves and their families through financial burdens such as medical expenses [28]. Therefore, to maintain HRQoL from the decline in physical function and increase in the prevalence of chronic diseases as older adults get older, facilities such as senior centers should be expanded, and step-by-step exercise programs suitable for each individual’s health condition should be actively explored.
This study is the first to assess sleep quality and physical activity using Fitbit and self-rated questionnaires in community-dwelling older adults aged 65 years and above to identify factors influencing HRQoL. However, this study assessed the sleep quality and physical activity of relatively healthy community-dwelling older adults who regularly attended a senior university or senior citizen centers. Therefore, it is difficult to assume that the results represent all community-dwelling older adults. Second, this study was a cross-sectional survey, which makes it difficult to establish a causal relationship between sleep quality, physical activity, and HRQoL. Third, awakening during sleep is a factor that can reduce sleep quality in the elderly, but this study did not measure awakening time or the number of awakenings during sleep; therefore, it is difficult to comprehensively evaluate sleep quality in older adults.
CONCLUSION
This study aimed to examine sleep quality and physical activity among community-dwelling older adults aged 65 years and above using Fitbit and self-rated questionnaires to determine the impact of these factors on HRQoL. The findings showed that HRQoL was positively related to physical activity (steps) measured by Fitbit and significantly related to sleep quality and physical activity measured using a self-rated questionnaire. Multiple regression analysis showed that physical activity and sleep quality measured by Fitbit were not influential factors on HRQoL in older adults. In contrast, physical activity, age, and subjective health status measured by self-rated questionnaires were significant factors, with an explanatory power of 46%.
Based on these findings, there are several suggestions. First, as this study was conducted in institutions such as a senior university and three senior citizen centers, it is necessary to repeat it in the future by expanding the number of participants to include older adults with various physical activity characteristics in the community. Second, the data utilized in this study are cross-sectional, which has limitations in suggesting causal relationships between variables; therefore, panel or cohort studies that can analyze the effects over time are needed. Third, senior friendly exercise programs to enhance physical activity are needed to improve HRQoL in older adults.
Notes
Authors' contribution
Conceptualization and study design - MUJ and YH; Methodology, MUJ; data analysis, MUJ; Writing–original draft preparation - MUJ and YH; Writing–review and editing - MUJ and YH. All authors have read and agreed to the published version of the manuscript.
Conflict of interest
No existing or potential conflict of interest relevant to this article was reported.
Funding
None.
Data availability
Please contact the corresponding author for data availability.
Acknowledgements
This article is based on a part of the first author’s thesis from Gyeongsang National University.